1. Understand service delivery
A hospital can examine how many patients attended its clinics and how attendance changed over time.
MODULE 1 · LESSON 1.1
Estimated time: 10–15 minutes
ON THE BOARD · Module 1 summary
Health data is collected every day. Collecting it is only the start.
MODULE SUMMARY
Health data is collected every day. Collecting it is only the start.
Learn the difference between raw data and information, and where health data comes from.
Look for missing values, late reports, and figures that cannot be true.
Say what a number describes, and what it cannot decide.
The board writes the point she is saying. It changes as the lesson moves on. Keep the sound on.
Let's start with something simple.
Imagine you sell oranges in a small shop.
On Monday, you sell 10 oranges. On Tuesday, you sell 15 oranges. On Wednesday, you sell 8 oranges.
You write the numbers in a notebook because you want to remember how many oranges you sell each day.

| Day | Oranges sold |
|---|---|
| Monday | 10 |
| Tuesday | 15 |
| Wednesday | 8 |
Congratulations! You have started collecting data.
But why would you collect these numbers?
Your numbers become useful when you start asking questions and using the answers to make decisions.
That is the basic idea behind data analytics.
A hospital also collects information every day.
For example, a fictional primary healthcare centre records the following patient attendance:
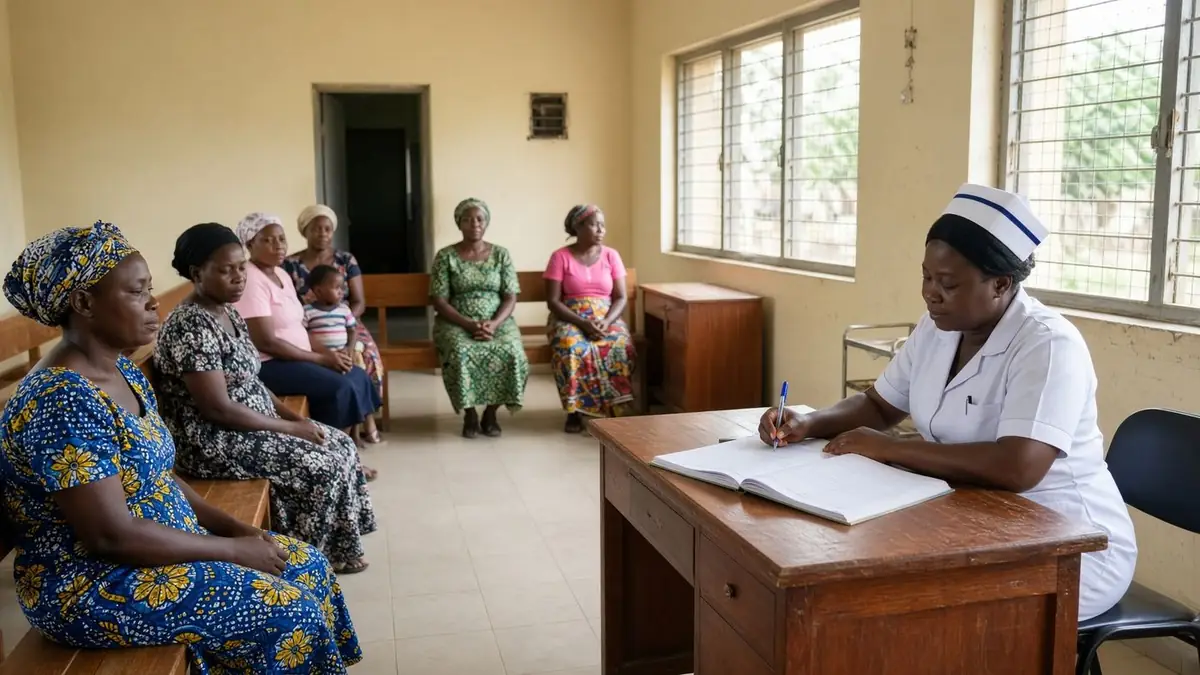
| Day | Patients attended |
|---|---|
| Monday | 45 |
| Tuesday | 60 |
| Wednesday | 38 |
These figures are health data.
A health information professional, administrator or data analyst might ask:
Notice something important.
The figures tell us how many patients attended. They do not, by themselves, explain why attendance changed or whether the quality of care improved.
We need to examine the information carefully before making decisions.
FRONTLINE TO DECISION
Health data is information collected about health, healthcare services, patients, diseases, health outcomes and health programmes.
Examples include:
Some health data consists of numbers. Other health data consists of words, descriptions or observations.
We will learn more about these differences in Lesson 1.2.
Health data analytics is the process of examining health data to identify patterns, answer questions, understand performance and support informed decisions.
Let's use our fictional healthcare centre again.
Suppose the facility records the following monthly attendance:
| Month | Patients attended |
|---|---|
| January | 800 |
| February | 950 |
| March | 700 |
An analyst can calculate totals, compare the months and identify changes.
However, the analyst should not immediately conclude that the facility performed better in February.
Why?
Because patient attendance alone does not tell us everything about healthcare performance.
We may need additional information about staffing, available services, patient needs, reporting completeness and other relevant factors.
Good analysis combines calculations with careful interpretation.
Health data analytics can help organisations:
A hospital can examine how many patients attended its clinics and how attendance changed over time.
An unusual decline in reported vaccinations may require investigation.
Reliable information can help managers assess staffing, equipment and supply needs.
An NGO can examine whether its activities are reaching the intended population.
Health authorities can use reliable evidence to help determine priorities and allocate resources.
Organisations can use documented results to explain what they achieved, where challenges remain and what needs to change.
The quality of the decisions depends partly on the quality, relevance and interpretation of the data.
Health data analytics is relevant to several professional groups.
Check record completeness and prepare health information reports.
Review service activity and support operational planning.
Monitor health indicators and investigate emerging concerns.
Track programme indicators and assess progress against targets.
Review service coverage and identify implementation gaps.
Examine datasets to answer research questions.
Prepare datasets, calculate indicators and communicate findings.
Use evidence to inform health planning and policy decisions.
You do not need to become an expert in every area. The aim is to develop practical skills that help you perform relevant tasks more effectively.
Answer these questions before looking at the suggested answers.
Choose an answer for each question, then check. The suggested answers stay hidden until you do.
1. A clinic records that 120 patients attended on Monday. What does 120 represent?
2. What is the main purpose of health data analytics?
3. A clinic reports fewer patients this month than last month. Can we immediately conclude that the quality of care has declined?
4. Which of the following is an example of health data?
In this lesson, you learned that: